Impx¶ ↑
Tool for plotting voltage attenuation at a specific measurement/injection site as a function of selected path along the neuron at each point of which current is injected/measured.
Frequency (Hz) of injected current is specified in the "frequency" field editor.
The measurement/injection site is selected by first selecting the measure/inject item of the SelectLocation menu and then selecting a location on the neuron in the middle panel. A red dot denotes the measurement (Vin mode) location or the injection location (Vout mode). The end points of the path are selected by first selecting the "path start" or "path end" menu items and then selecting a location on the neuron in the middle panel.
The Vin and Vout radio buttons select whether the independent variable in the results panel refers to injection position or measurement position along the selected path. The x=0 coordinate in the results section refers to the point on the path that is closest to the root of the cell (The root is normally the soma). Negative abscissa values are on the path start side and positive values are on the path end side.
This tool uses the Impedance class to calculate voltage attenuations.
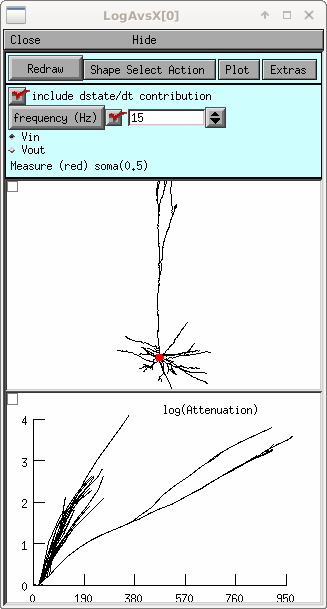
LogAvsX¶ ↑
Tool for plotting voltage attenuation at a specific measurement/injection site as a function of Every point on the cell where current is injected/measured. Abscissa in the results panel shows the distance of every point from the root of the cell (usually soma(0)).
When the Vin radio button is selected the measurement site is fixed (red dot) and the independent variable is the location of the injection site. When Vout is selected, the independent variable is the measurement location and the red dot refers to the fixed injection site.
In order to identify a particular section in the morphology panel with a particular line segment in the results panel one can:
- In the results panel use the graph menu (right mouse button) to select the "ShowPosition" item. Then click (left mouse button) near the beginning, end, or segment center of one of the lines. This will color red both the line and the corresponding morphology section.
- The meaning of the Section menu item in the morphology panel is determined by the ShapeSelectAction menu item in the control panel. When MoveElectrode is selected (and the Section menu item tool is also selected) clicking on a section of the cell, changes the location of the 'fixed' measurement/injection site (red dot). When ShowPosition is selected, clicking on a section will color both the section and the corresponding line in the results panel.